ELIZE Invest Solutions analyses indicate the opinion of our analysts at a given moment. They always consist of a chart image and text comments, which provide useful key levels for a potential action strategy. The decision to invest (or not to invest) is always that of the investor, depending on the risk that he or she is ready to take and willing to assume. ELIZE Invest Solutions analyses are intended to assist the investor in his or her approach.
Technical Analysis applies to all listed financial instruments (equities, indices, currencies, commodities, interest rate products) provided that a sufficient transaction volume (liquidity) allows for a relevant analysis. This involves observing previous market movements and determining price trends in order to try and anticipate and monitor future movements.
It allows you to establish a risk management strategy and to build an investment strategy based on prices and market psychology.
ELIZE Invest Solutions research includes:
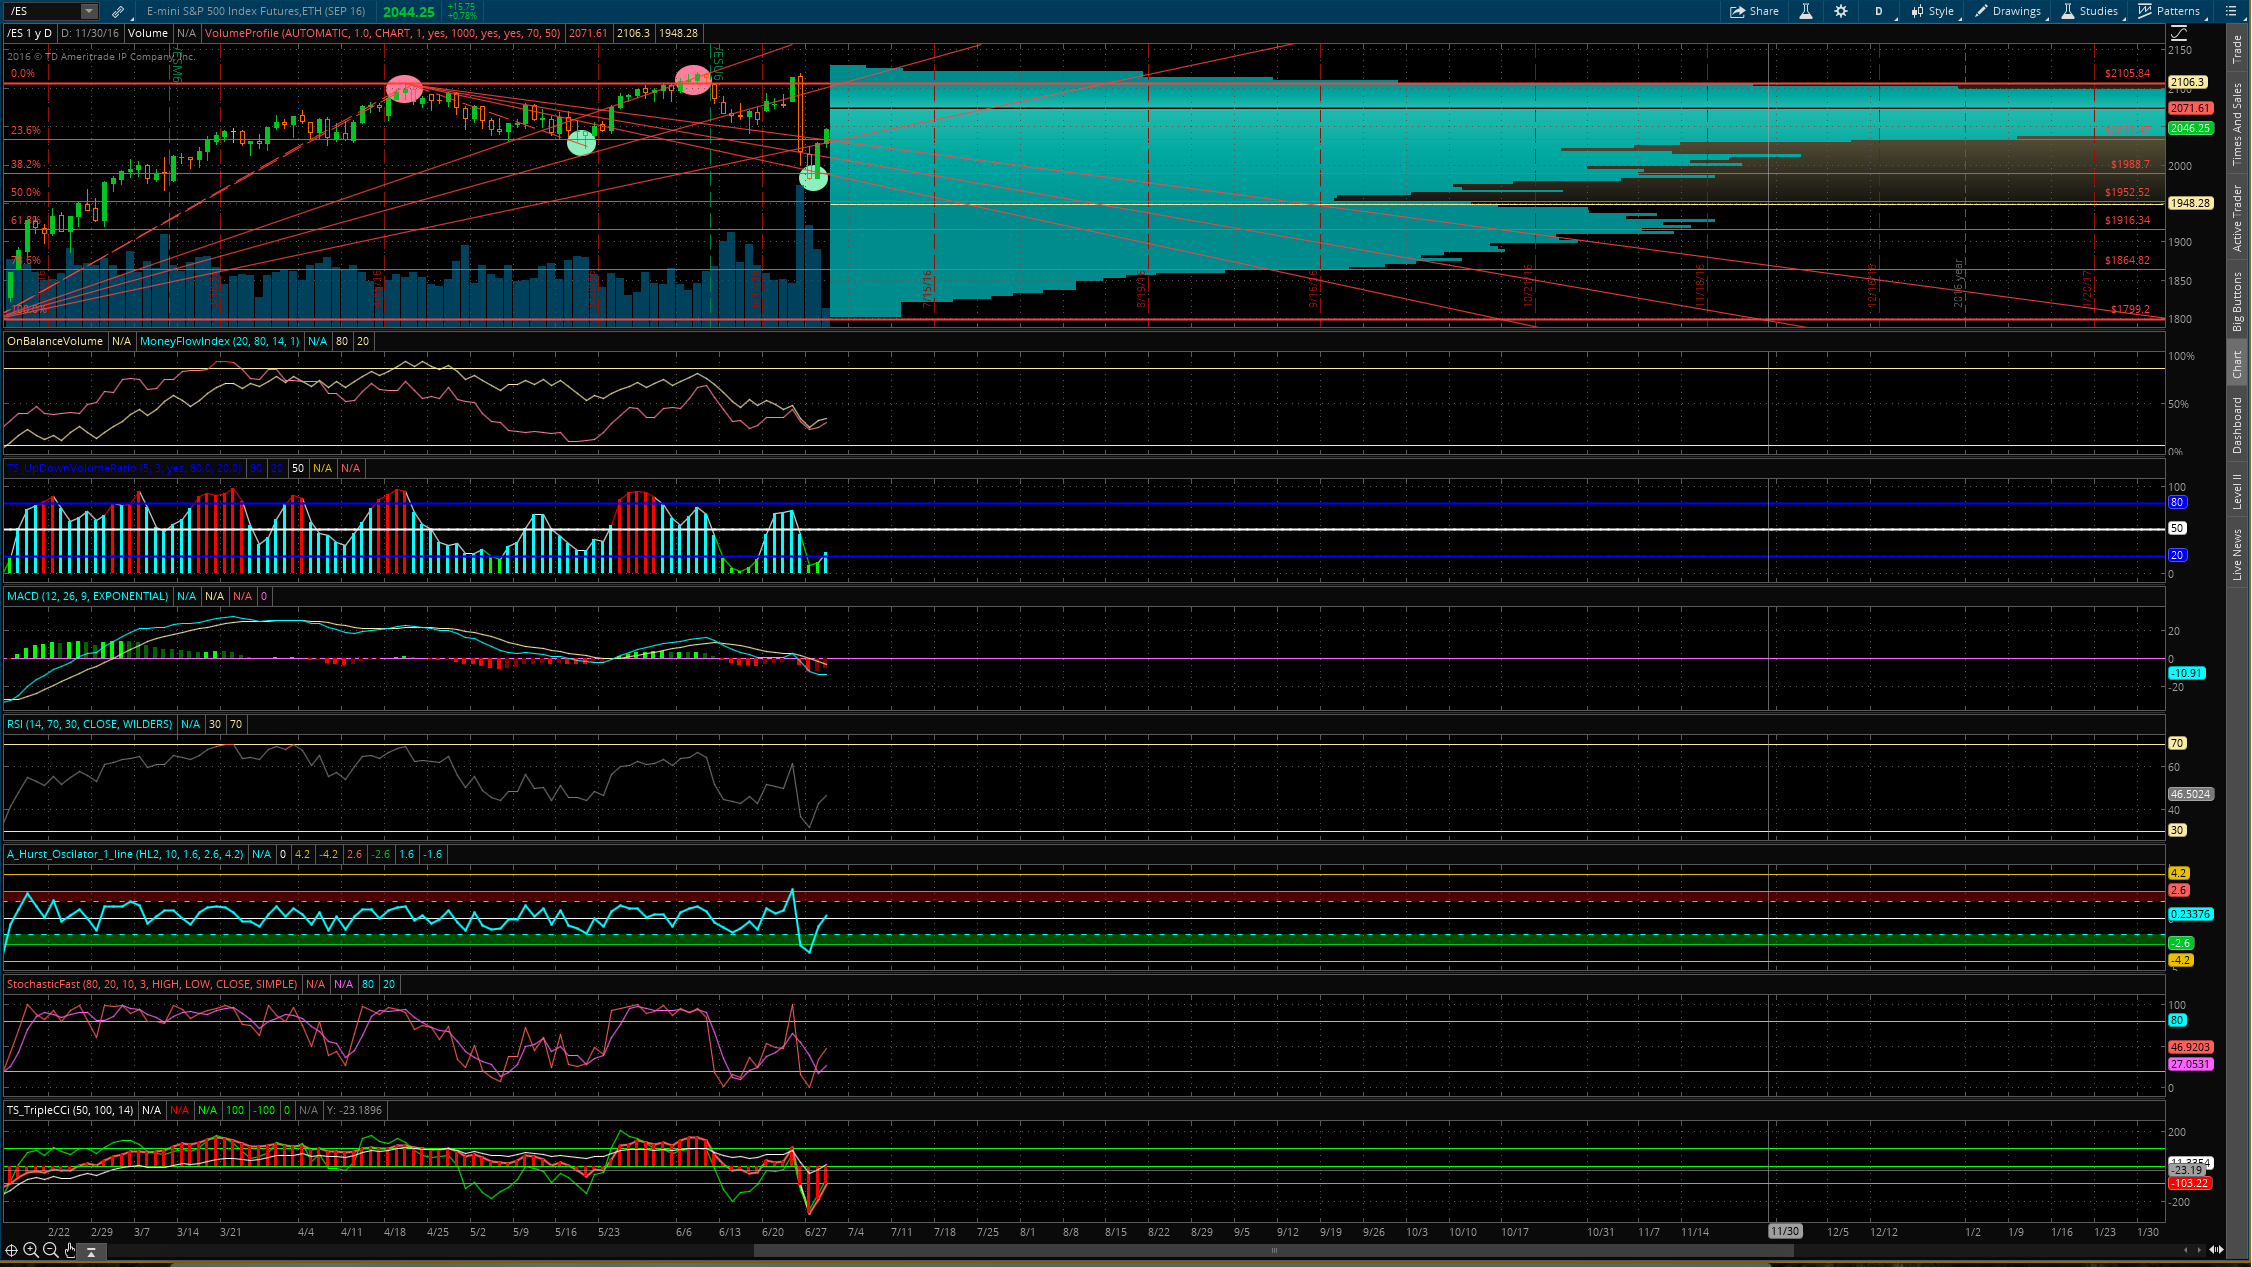
- Technical chart analysis to determine the direction of price movement and goals
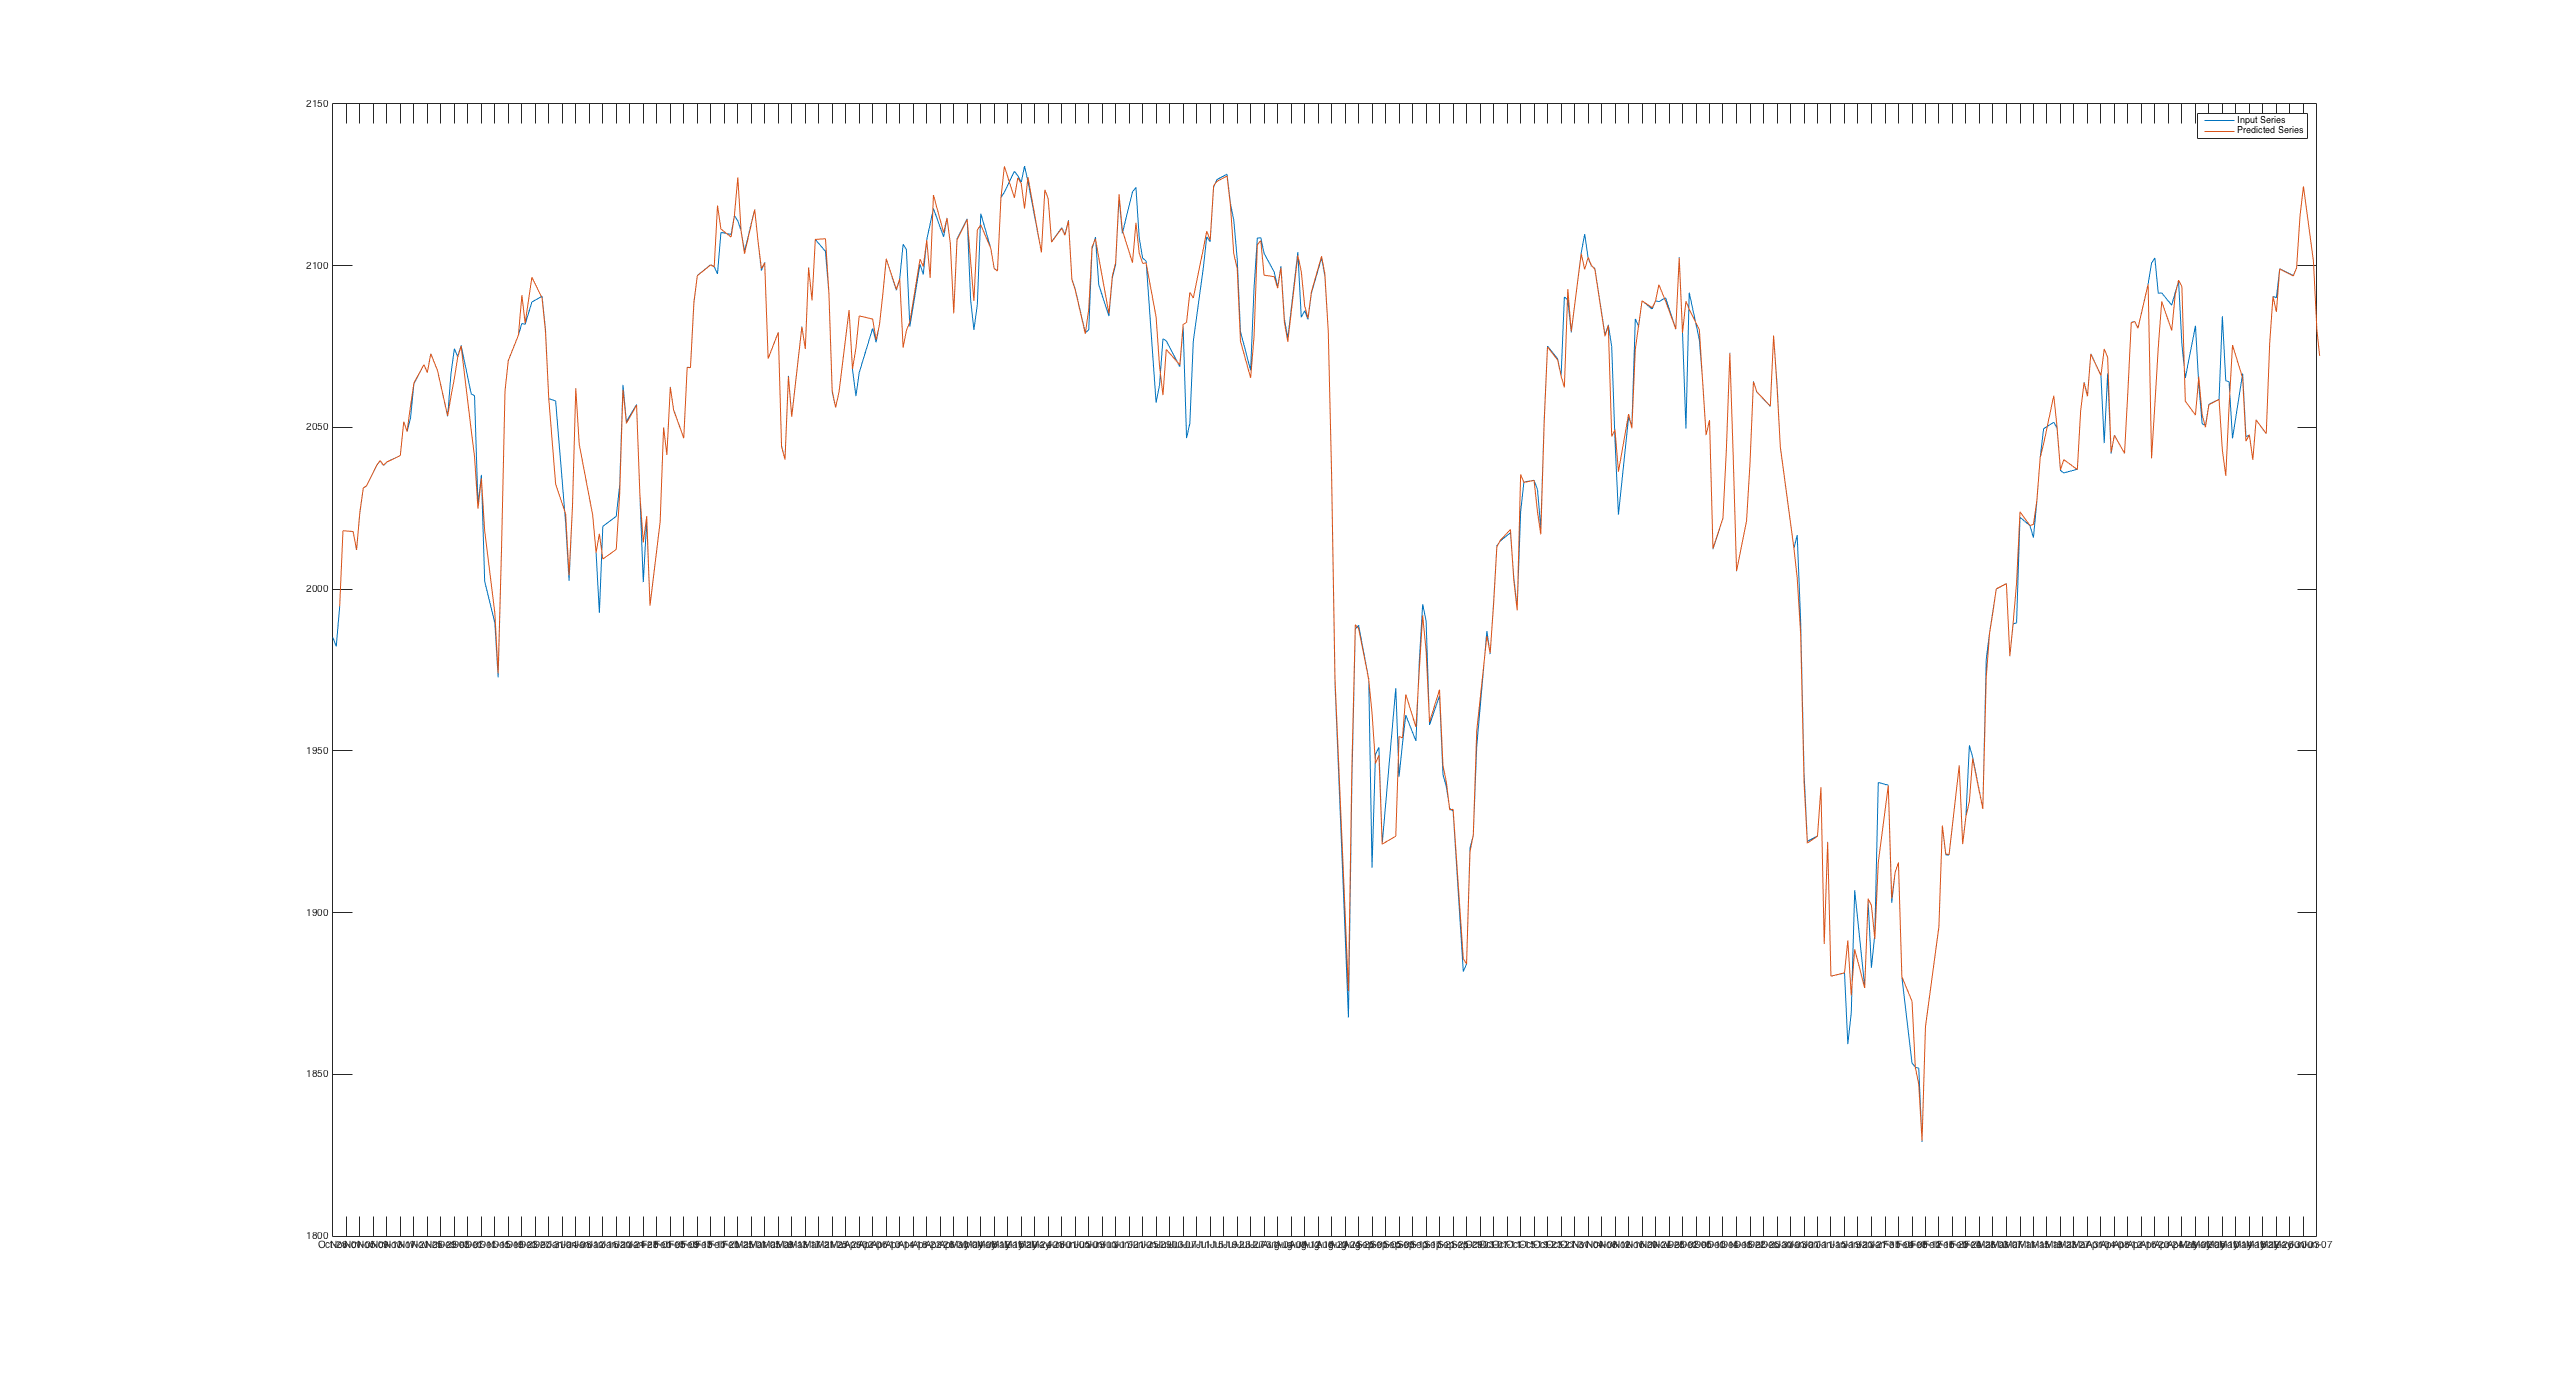
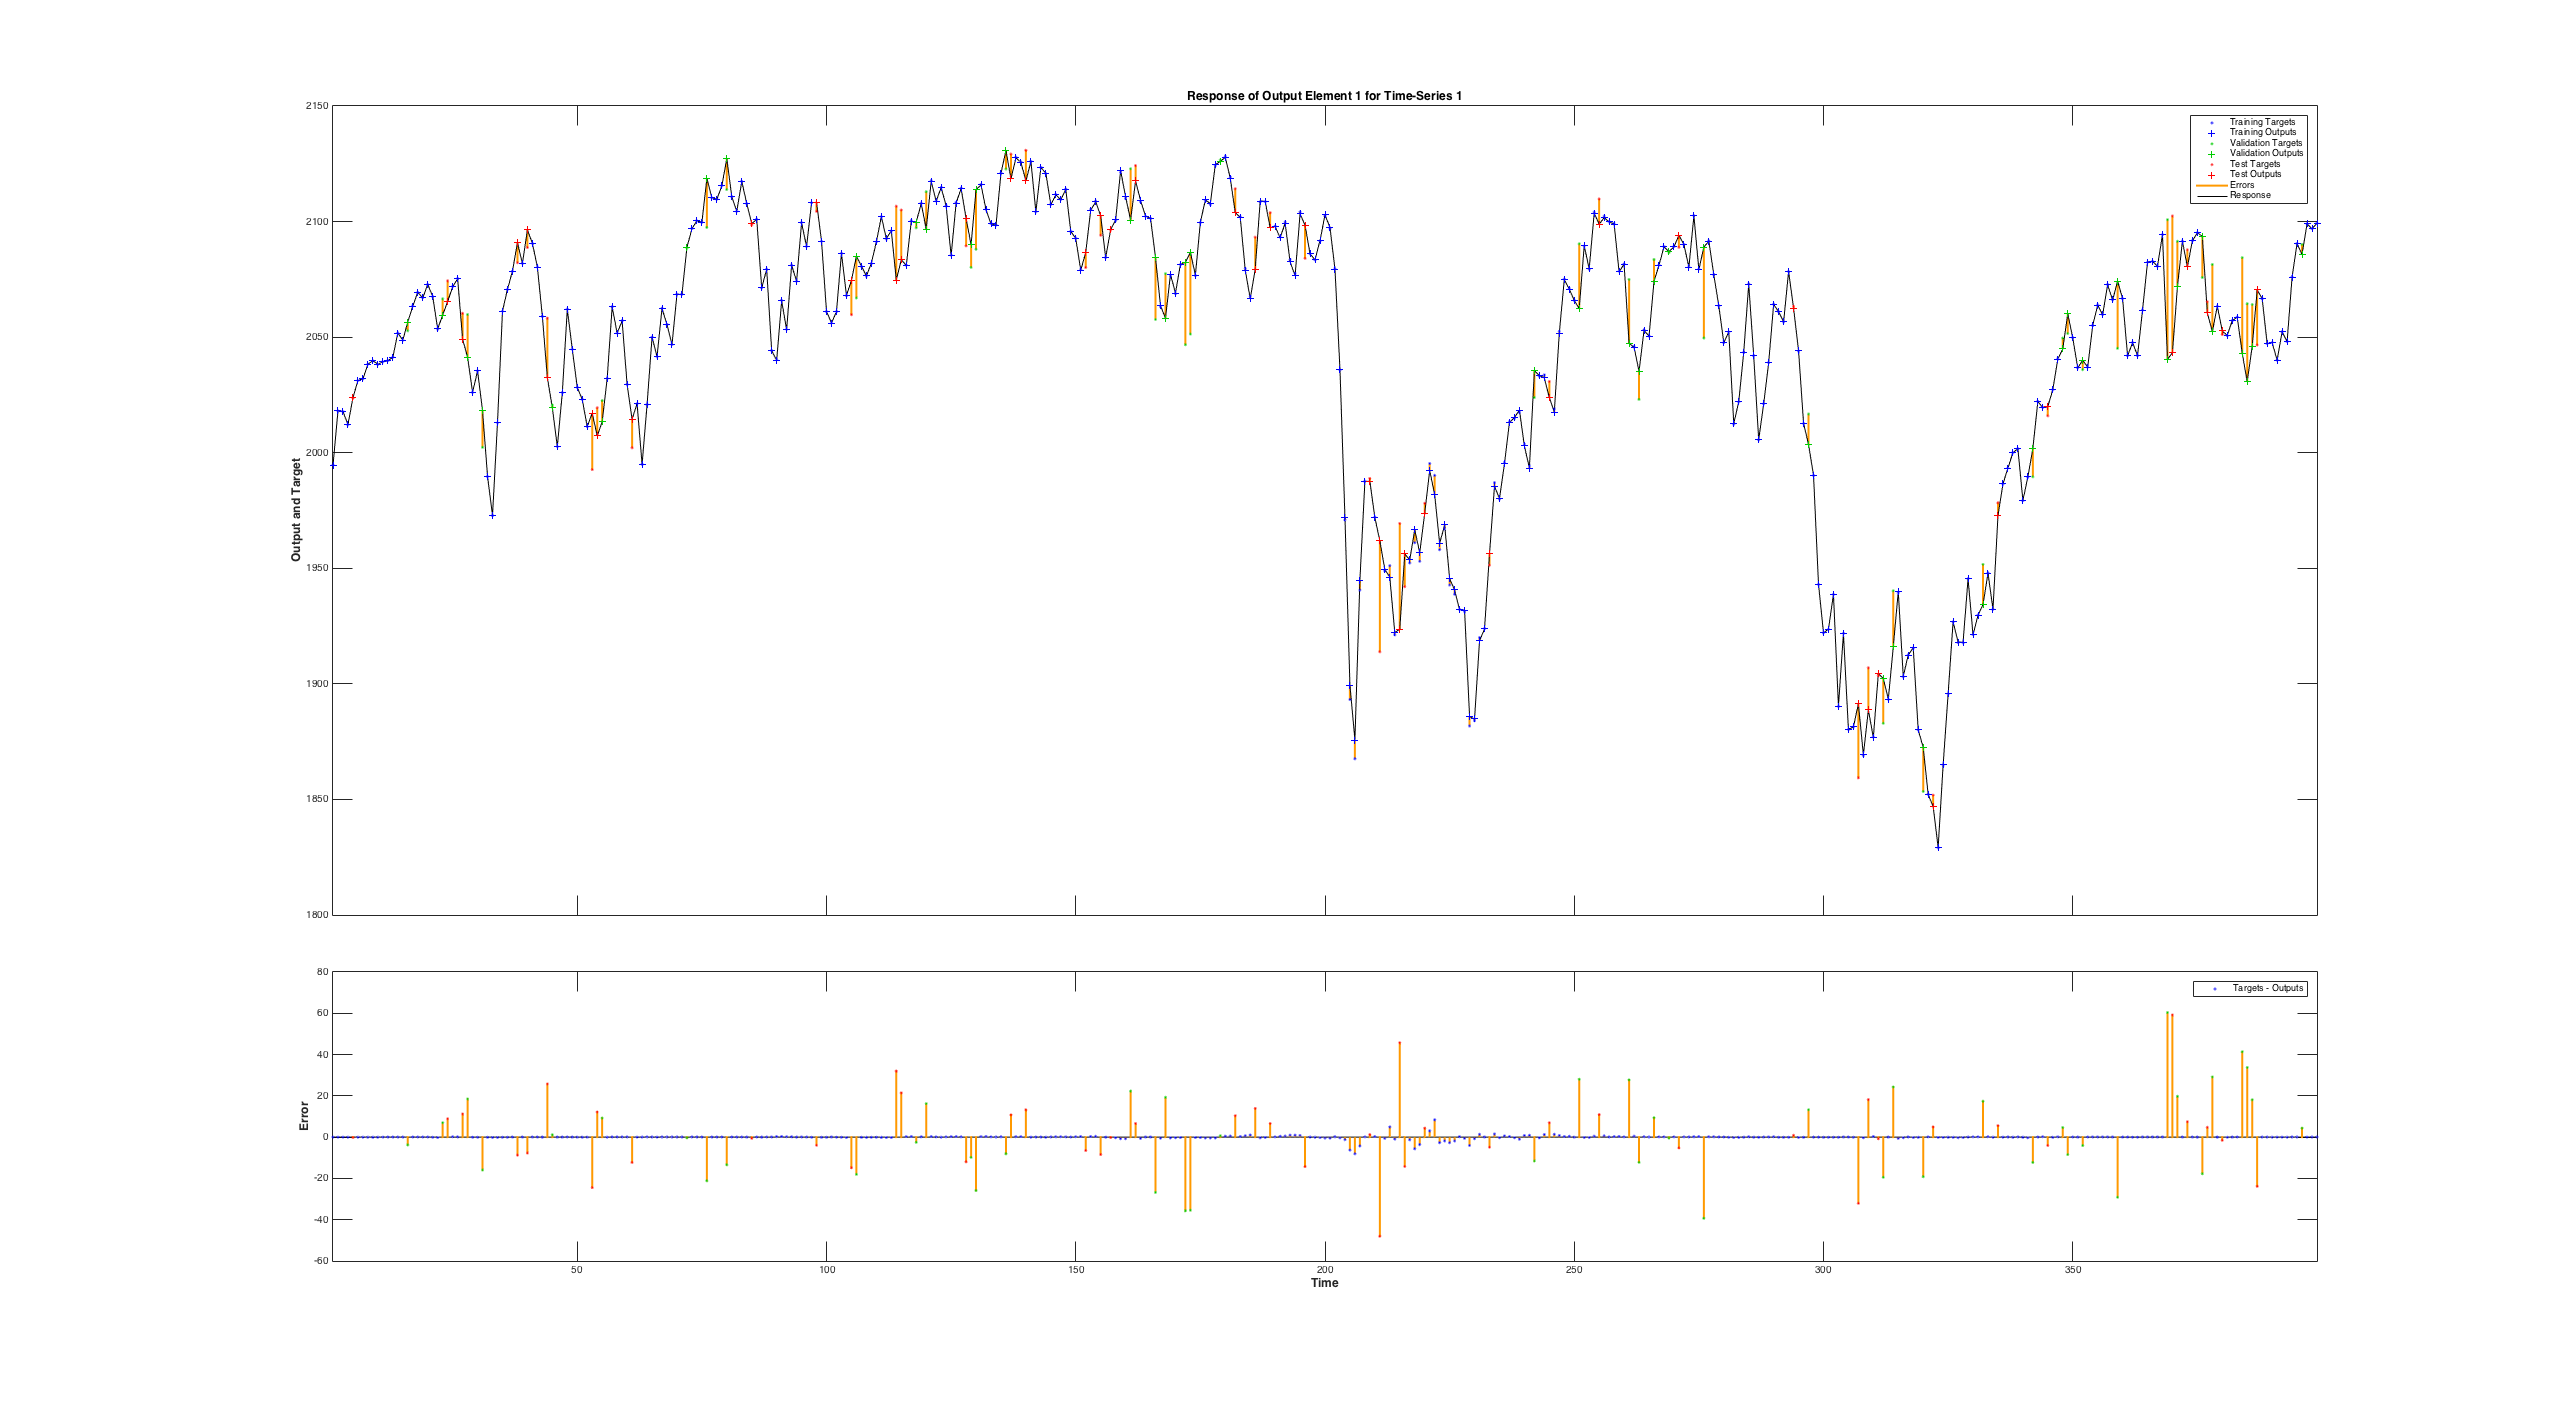
- The forecast based on data from neural networks ELIZE
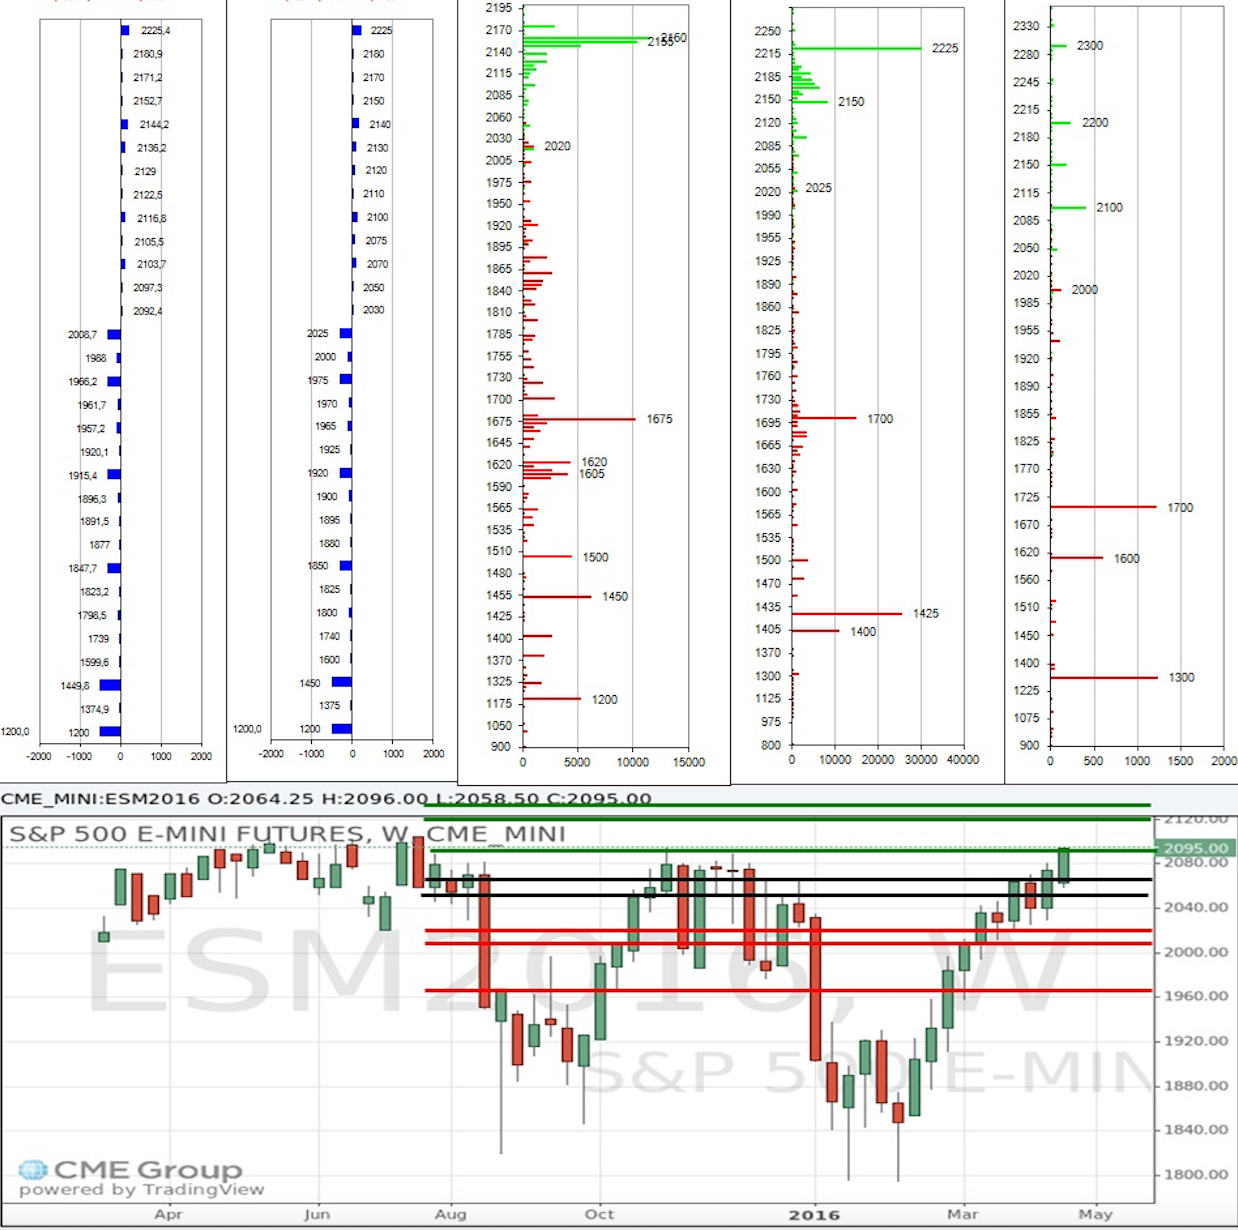
- Unique mathematical formulas to predict market makers directions
Technical Analysis
The market takes everything into account
Technical Analysis starts from a simple financial principle: at a given moment in time (“T”), the price of a financial instrument accurately reflects all the information available on that instrument, i.e., its entire history. If the market is sufficiently liquid, it is possible to use previous price changes to determine the most likely future changes.
Trend is an essential concept: following a trend means sticking to the direction of the market at a given moment.
Price is the result of the power struggle between buyers and sellers. Evaluating the majority opinion allows to act efficiently on the markets.
Prices reflect market psychology
Psychological effects can prove to be just as important as purely fundamental considerations. Different opinions can be formed, even when relating to similar information. It is on this very principle that prices are determined, and reflect a market consensus between buying and selling positions.
Technical Analysis does not aim to determine the precise reasons for price moves but rather to measure the evolution of prices and, if possible, to determine their likely future behavior.
This approach thus allows to better understand the operators’ psychology.
History repeats itself ─ past configurations stick to the minds of stakeholders and will tend to be repeated in the future.
The market is sometimes irrational ─ the operators’ emotional reactions sometimes produce exaggerations ─ the stakeholders’ fears as well as their hopes play an important role that fundamental analysis does not take into consideration. Technical Analysis is an essential tool for integrating this psychological dimension on the markets.
Neural Network
This method of analysis, comprising many different units for processing the incoming data, which are connected to each other weighted probabilities. This name is borrowed from the experts working with the systems of artificial intelligence. Neural networks are a novelty in the investment market and to define if a little simplistic, the neural network – this is such a model, which in general can reproduce human brain mechanism of action and learning.
Neural Network model used in the field of artificial intelligence to design computers that could think and learn by taking as a basis the results of actions committed.
Our Neural Network named ELIZE
The accuracy of ELIZE Capital Solutions forecasts, based on ELIZE Neural Network without using other methods of analysis, demonstrating more than 90% accuracy of the market direction for the day ahead. These were confirmed by our own research for 5 years, as well as the method of statistical hypothesis testing (statistical tests), based on the Student’s t-distribution.
Example:
S&P500 02/06-2016
Mathematical formulas
We analyze the strategies of large institutions, based on optional defenses and forward contracts by applying mathematical formulas to determine the direction of the market in a particular area.
Example:
The neutral range is very narrow: 2051 – 2069. This is a sign of impending volatility amplification.
Trading above / below will determine the risks.
The nearest resistance – 2092 (price here). This resistance is due to the level of 2100, which had previously worked as protection and has no force at this time. The following resistance: (2118 – 2134) (in principle from the point of view of the risks, but can easily be completed) – (2167 – 2176) (strong) – 2217 – 2231 (protection). Potential target in 2222 is maintained.
Nearest support: the actual neutral range of 2069 – 2051. Next: (2020 – 2009) (very strong and principled in terms of risks, protecting the psychological level of 2000); (1971 – 1967) (strong) – (1925 – 1922) (a security feature).


